Chart Examples
This guide showcases the different chart configurations available through the tibber_prices.get_apexcharts_yaml action.
Quick Start: Call the action with your desired parameters, copy the generated YAML, and paste it into your Lovelace dashboard!
Overview
The integration can generate 4 different chart modes, each optimized for specific use cases:
| Mode | Description | Best For | Dependencies |
|---|---|---|---|
| Today | Static 24h view of today's prices | Quick daily overview | ApexCharts Card |
| Tomorrow | Static 24h view of tomorrow's prices | Planning tomorrow | ApexCharts Card |
| Rolling Window | Dynamic 48h view (today+tomorrow or yesterday+today) | Always-current overview | ApexCharts + Config Template Card |
| Rolling Window Auto-Zoom | Dynamic view that zooms in as day progresses | Real-time focus on remaining day | ApexCharts + Config Template Card |
Screenshots available for:
- ✅ Today (static) - Representative of all fixed day views
- ✅ Rolling Window - Shows dynamic Y-axis scaling
- ✅ Rolling Window Auto-Zoom - Shows progressive zoom effect
All Chart Modes
1. Today's Prices (Static)
When to use: Simple daily price overview, no dynamic updates needed.
Dependencies: ApexCharts Card only
Generate:
service: tibber_prices.get_apexcharts_yaml
data:
    entry_id: YOUR_ENTRY_ID
    day: today
    level_type: rating_level
    highlight_best_price: true
Screenshot:
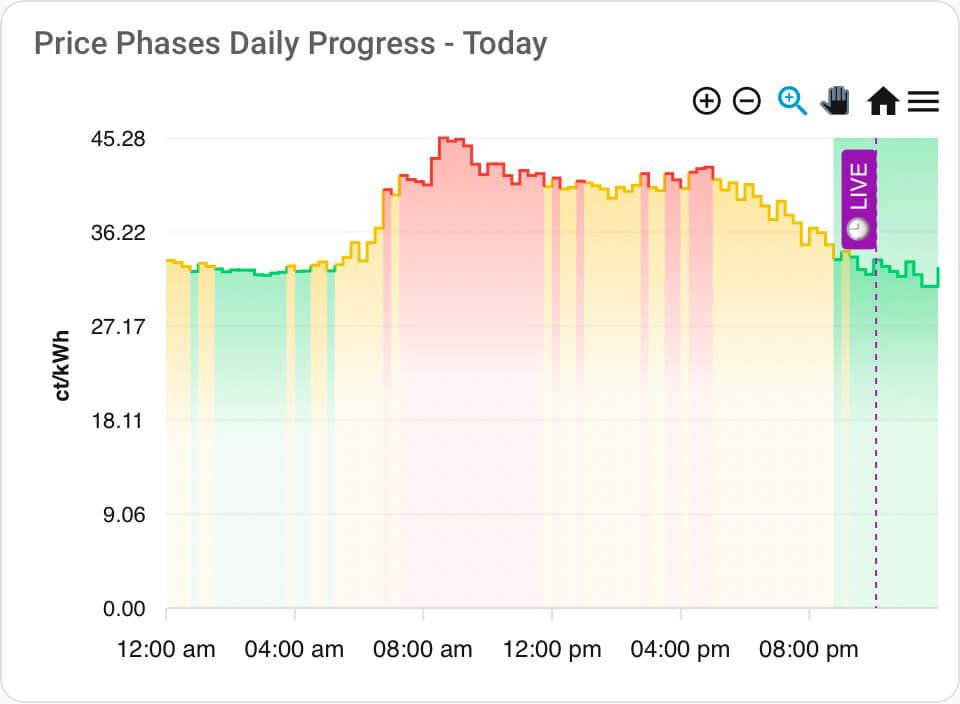
Key Features:
- ✅ Color-coded price levels (LOW, NORMAL, HIGH)
- ✅ Best price period highlights (vertical bands)
- ✅ Static 24-hour view (00:00 - 23:59)
- ✅ Works with ApexCharts Card alone
Note: Tomorrow view (day: tomorrow) works identically to Today view, just showing tomorrow's data. All fixed day views (yesterday/today/tomorrow) use the same visualization approach.
2. Rolling 48h Window (Dynamic)
When to use: Always-current view that automatically switches between yesterday+today and today+tomorrow.
Dependencies: ApexCharts Card + Config Template Card
Generate:
service: tibber_prices.get_apexcharts_yaml
data:
    entry_id: YOUR_ENTRY_ID
    # Omit 'day' for rolling window
    level_type: rating_level
    highlight_best_price: true
Screenshot:
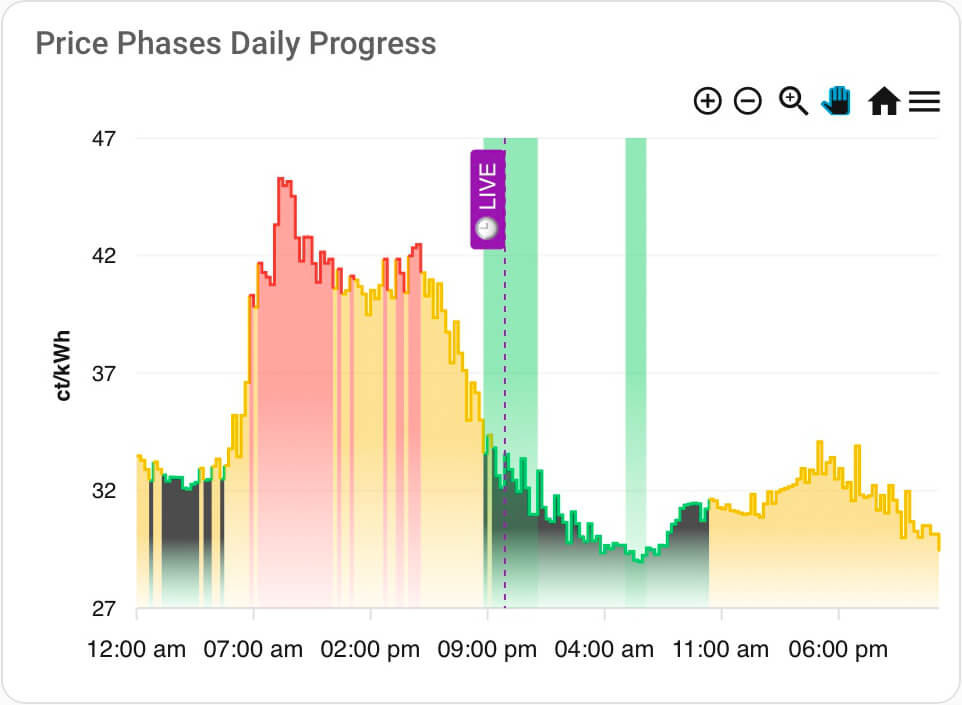
Key Features:
- ✅ Dynamic Y-axis scaling via
chart_metadatasensor - ✅ Automatic data selection: today+tomorrow (when available) or yesterday+today
- ✅ Always shows 48 hours of data
- ✅ Updates automatically when tomorrow's data arrives
- ✅ Color gradients for visual appeal
How it works:
- Before ~13:00: Shows yesterday + today
- After ~13:00: Shows today + tomorrow
- Y-axis automatically adjusts to data range for optimal visualization
3. Rolling Window Auto-Zoom (Dynamic)
When to use: Real-time focus on remaining day - progressively zooms in as day advances.
Dependencies: ApexCharts Card + Config Template Card
Generate:
service: tibber_prices.get_apexcharts_yaml
data:
    entry_id: YOUR_ENTRY_ID
    day: rolling_window_autozoom
    level_type: rating_level
    highlight_best_price: true
Screenshot:
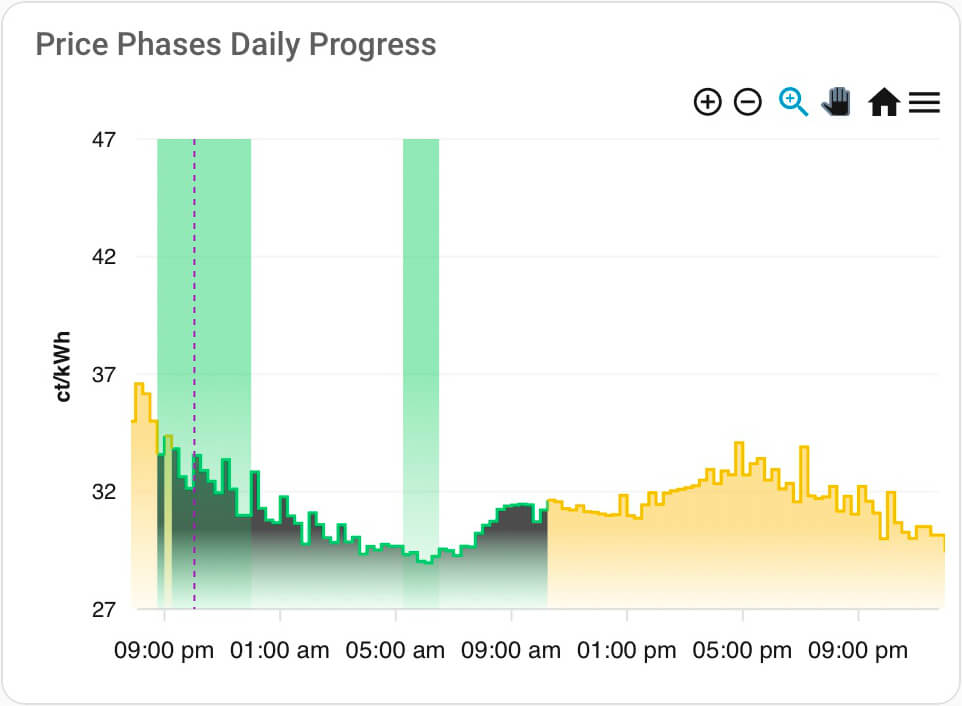
Key Features:
- ✅ Progressive zoom: Graph span decreases every 15 minutes
- ✅ Dynamic Y-axis scaling via
chart_metadatasensor - ✅ Always shows: 2 hours lookback + remaining time until midnight
- ✅ Perfect for real-time price monitoring
- ✅ Example: At 18:00, shows 16:00 → 00:00 (8h window)
How it works:
- 00:00: Shows full 48h window (same as rolling window)
- 06:00: Shows 04:00 → midnight (20h window)
- 12:00: Shows 10:00 → midnight (14h window)
- 18:00: Shows 16:00 → midnight (8h window)
- 23:45: Shows 21:45 → midnight (2.25h window)
This creates a "zooming in" effect that focuses on the most relevant remaining time.
Comparison: Level Type Options
Rating Level (3 series)
Based on your personal price thresholds (configured in Options Flow):
- LOW (Green): Below your "cheap" threshold
- NORMAL (Blue): Between thresholds
- HIGH (Red): Above your "expensive" threshold
Best for: Personal decision-making based on your budget
Level (5 series)
Based on absolute price ranges (calculated from daily min/max):
- VERY_CHEAP (Dark Green): Bottom 20%
- CHEAP (Light Green): 20-40%
- NORMAL (Blue): 40-60%
- EXPENSIVE (Orange): 60-80%
- VERY_EXPENSIVE (Red): Top 20%
Best for: Objective price distribution visualization
Dynamic Y-Axis Scaling
Rolling window modes (2 & 3) automatically integrate with the chart_metadata sensor for optimal visualization:
Without chart_metadata sensor (disabled):
┌─────────────────────┐
│                     │ ← Lots of empty space
│      ___            │
│  ___/   \___        │
│_/           \_      │
├─────────────────────┤
0              100 ct
With chart_metadata sensor (enabled):
┌─────────────────────┐
│      ___            │ ← Y-axis fitted to data
│  ___/   \___        │
│_/           \_      │
├─────────────────────┤
18             28 ct   ← Optimal range
Requirements:
- ✅ The
sensor.tibber_home_chart_metadatamust be enabled (it's enabled by default!) - ✅ That's it! The generated YAML automatically uses the sensor for dynamic scaling
Important: Do NOT disable the chart_metadata sensor if you want optimal Y-axis scaling in rolling window modes!
Note: Fixed day views (today, tomorrow) use ApexCharts' built-in auto-scaling and don't require the metadata sensor.
Best Price Period Highlights
When highlight_best_price: true, vertical bands overlay the chart showing detected best price periods:
Example:
Price
  │
30│           ┌─────────┐  Normal prices
  │           │         │
25│     ▓▓▓▓▓▓│         │  ← Best price period (shaded)
  │     ▓▓▓▓▓▓│         │
20│─────▓▓▓▓▓▓│─────────│
  │     ▓▓▓▓▓▓
  └─────────────────────── Time
       06:00  12:00  18:00
Features:
- Automatic detection based on your configuration (see Period Calculation Guide)
- Tooltip shows "Best Price Period" label
- Only appears when periods are configured and detected
- Can be disabled with
highlight_best_price: false
Prerequisites
Required for All Modes
- ApexCharts Card: Core visualization library
# Install via HACSHACS → Frontend → Search "ApexCharts Card" → Download
Required for Rolling Window Modes Only
- Config Template Card: Enables dynamic configuration
# Install via HACSHACS → Frontend → Search "Config Template Card" → Download
Note: Fixed day views (today, tomorrow) work with ApexCharts Card alone!
Tips & Tricks
Customizing Colors
Edit the colors array in the generated YAML:
apex_config:
    colors:
        - "#00FF00" # Change LOW/VERY_CHEAP color
        - "#0000FF" # Change NORMAL color
        - "#FF0000" # Change HIGH/VERY_EXPENSIVE color
Changing Chart Height
Add to the card configuration:
type: custom:apexcharts-card
graph_span: 48h
header:
    show: true
    title: My Custom Title
apex_config:
    chart:
        height: 400 # Adjust height in pixels
Combining with Other Cards
Wrap in a vertical stack for dashboard integration:
type: vertical-stack
cards:
    - type: entity
      entity: sensor.tibber_home_current_interval_price
    - type: custom:apexcharts-card
      # ... generated chart config
Next Steps
- Actions Guide: Complete documentation of
get_apexcharts_yamlparameters - Chart Metadata Sensor: Learn about dynamic Y-axis scaling
- Period Calculation Guide: Configure best price period detection
Screenshots
Gallery
-
Today View (Static) - Representative of all fixed day views (yesterday/today/tomorrow)
-
Rolling Window (Dynamic) - Shows dynamic Y-axis scaling and 48h window
-
Rolling Window Auto-Zoom (Dynamic) - Shows progressive zoom effect
Note: Tomorrow view is visually identical to Today view (same chart type, just different data).
💬 Comments are page-specific. For a new question or idea, open a dedicated Discussion on GitHub so it gets its own thread and proper visibility.